Insights for all…
Too often, Finance teams are spending up to 80% of their time on:
- Manual data consolidation and review processes
- Excel-based models that are hard to maintain and prone to error
- Producing schedule-based reporting packs
With our Empower platform you can:
- Connect to source data
- Supplement with additional adjustments where needed
- Analyze data and add commentary
- Distribute reports to PDF, PPT or XLS with bulk publishing
- Automate the reporting process from end-to-end
Use Cases
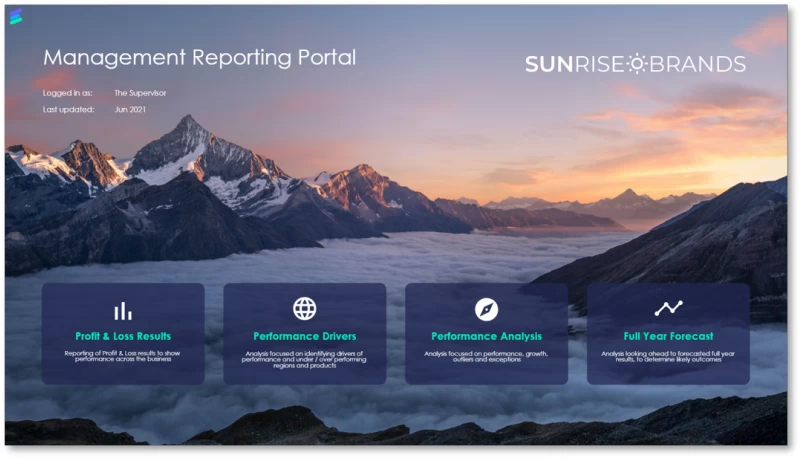
Management reporting
Look and feel IS important!
Wow your leadership team with an on-brand look-and-feel and achieve the best layout for your data. Fully customize all aspects of the report including layouts, styling, table, and data formatting
Board packs
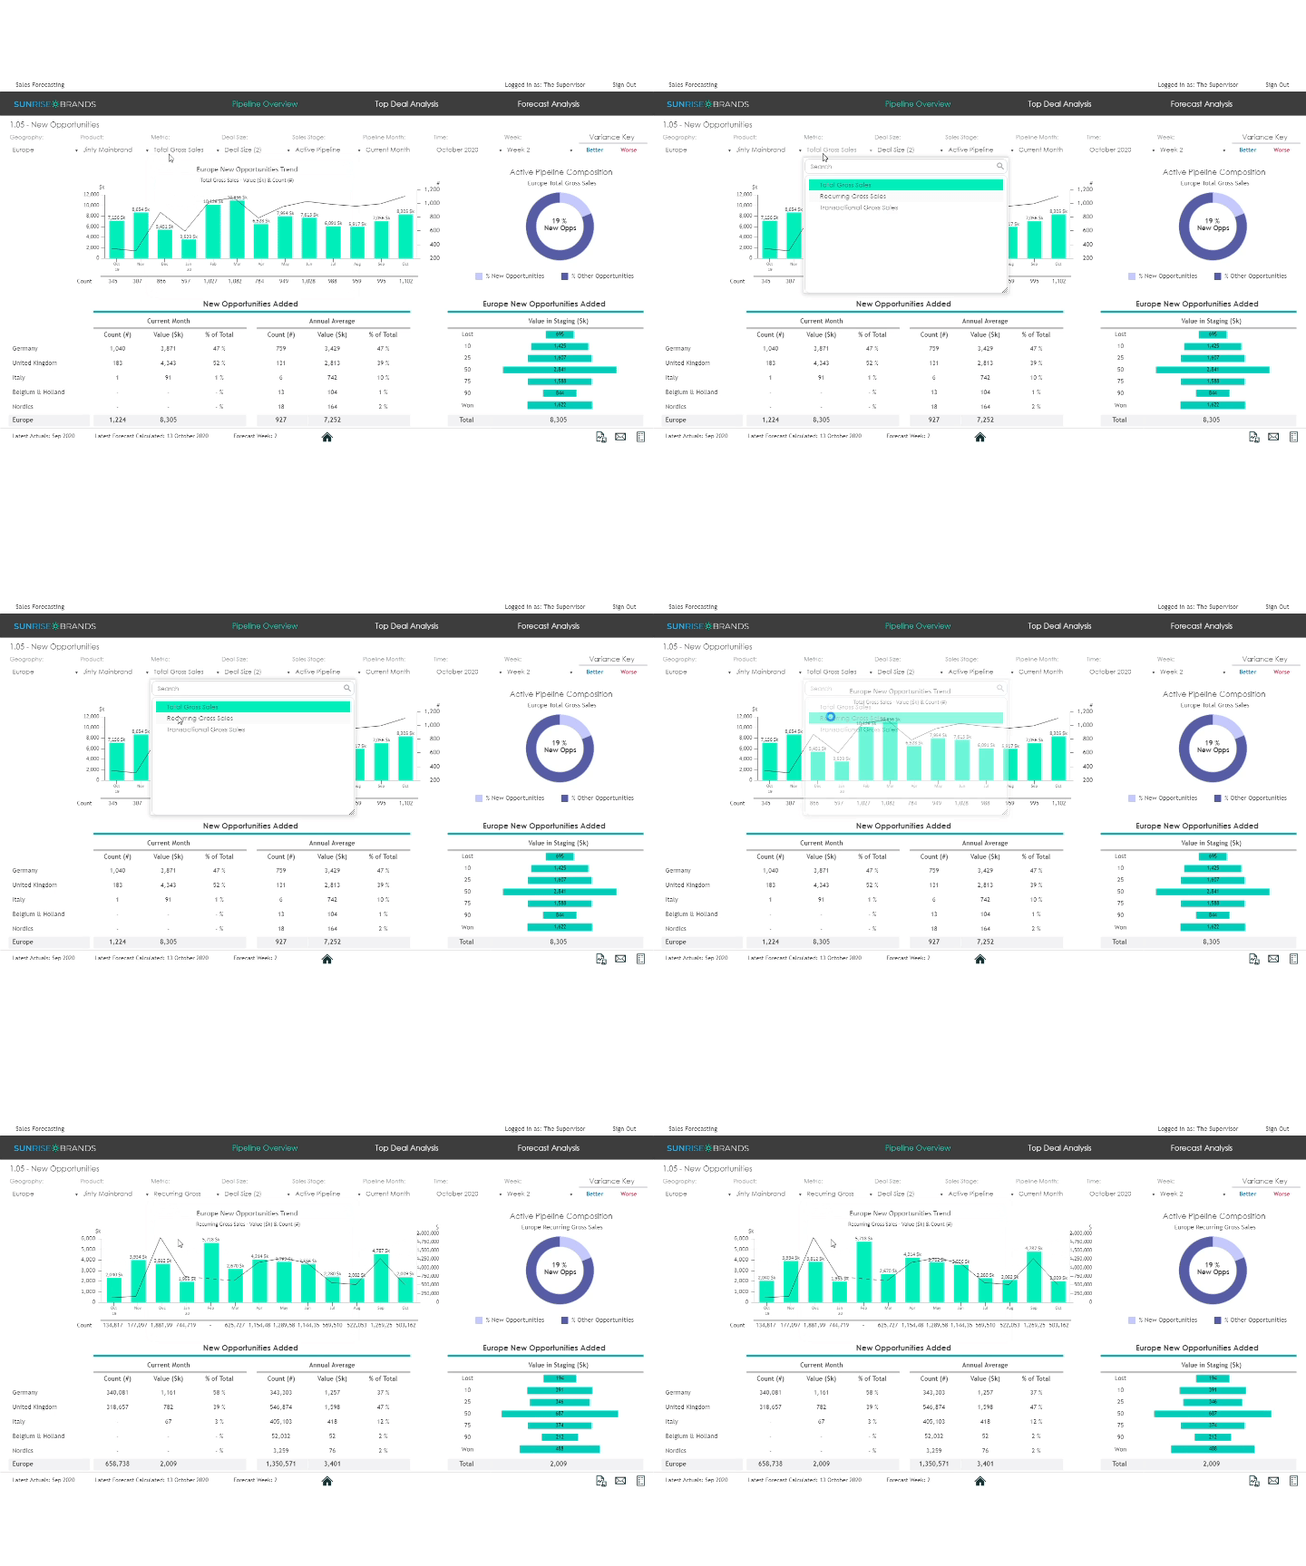
Guided navigation that helps users navigate within two clicks to go through summary results in more detail. This can be to explore performance across different business dimensions.
Commentary workflow management
Our extensive library of charts and visualizations, many created in-house leveraging our deep expertise in financial and performance management, help you gain insights that would otherwise be lost.
KPI dashboards
Numbers don’t lie. Make sure the numbers tell their story louder than any other meeting goers.
Remove the noise, and show only the most important information.
Financial close reporting
Add insights to data!
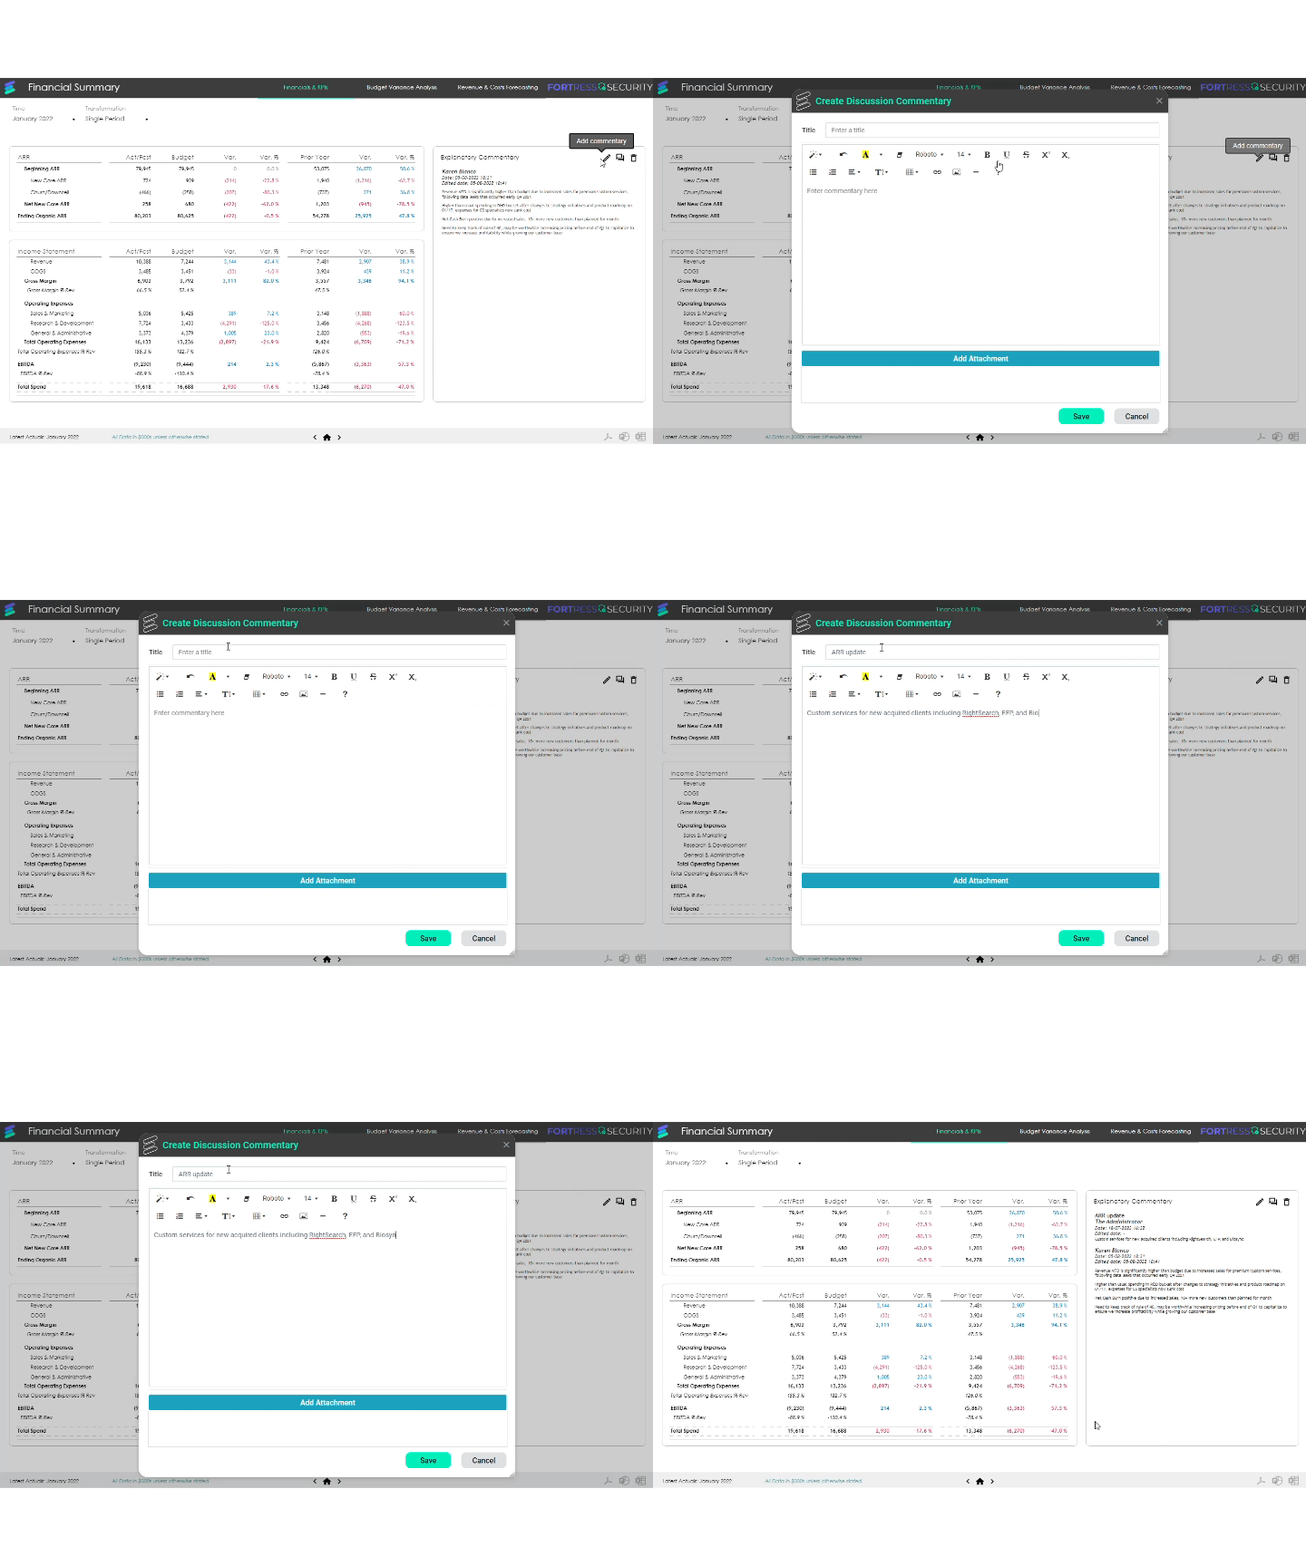
We provide a powerful way to augment analyses with explanations, narrations, and annotations.
Performance Management for the whole business
Connect financial and operational drivers
Link market and operational drivers with financial outcomes in a consistent model of performance used throughout the business.
Define KPIs and build logic for metrics and data aggregations with our powerful modeling engine for a single source for clarity.
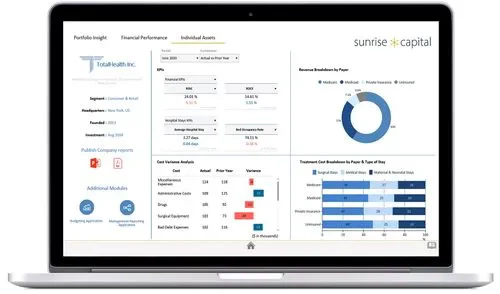
Dashboards
Reporting with commentary
Develop visual, guided analysis that can be tailored for business or board level user self-service, whilst being based on a performance model and data governance owned by central finance.
Attain advanced visualizations designed for delivering insight to business leaders and annotate with commentary and context.
Financial Intelligence
Built-in finance intelligence
Designed by Finance people, for Finance people and business leaders. We understand the complexities that you deal with and have baked-in solutions:
- Built-in Time Intelligence with understanding of Flows and Stock balances
- Comparative accounting period analysis
- Data analysis across alternate hierarchies
- Multiple Scenarios with flexible comparison
- Weighting factors to show good and bad variances in the correct way
- Out of the box-finance visualizations such as waterfall charts
And so much more.
Automation
Automate and publish
Configure workflows to automate cross-business reporting processes and data updates from source systems.
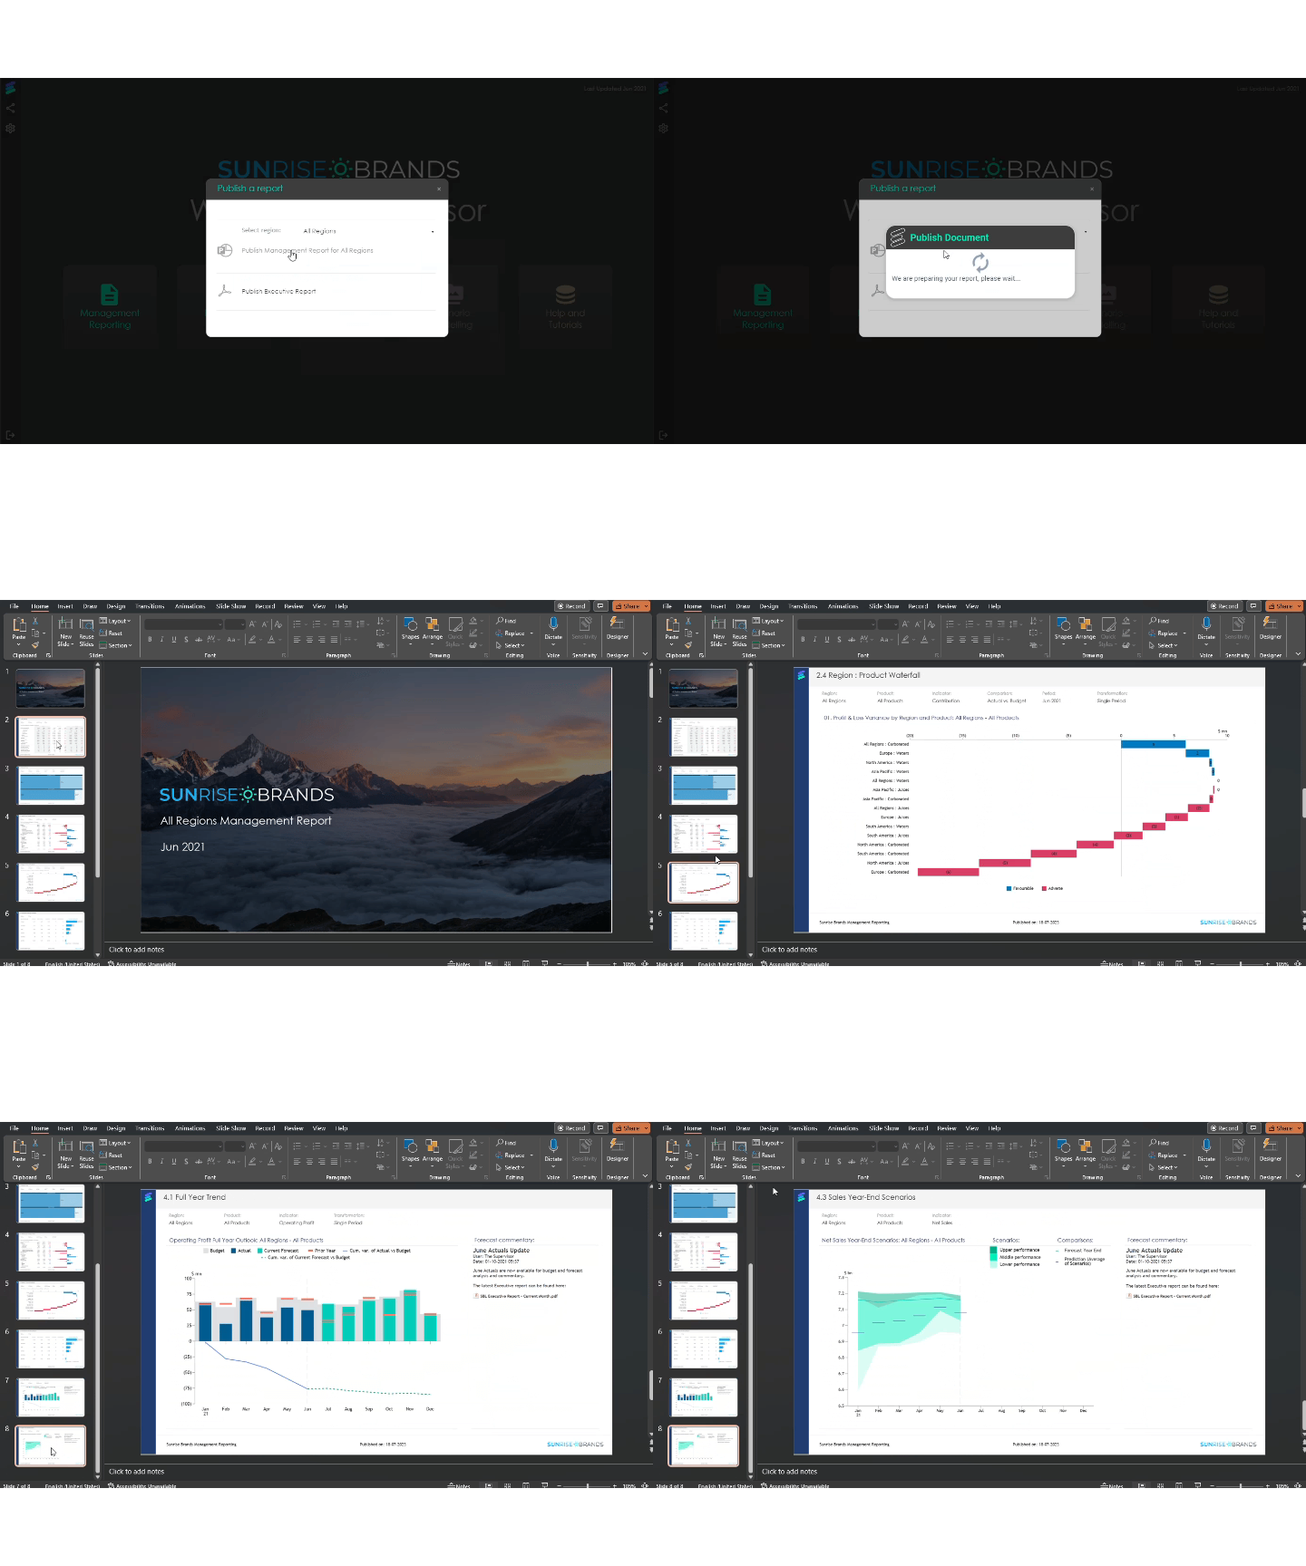
Publish analysis to users in interactive web dashboards, or distribute reports using our Bulk publish capability to automate completely the creation of management packs, turning what has typically been days of manual work into a fully-automated process.
Office Add-ins for PowerPoint and Excel help you get your data into Presentations and Spreadsheets, most commonly used for Reporting and ad hoc data analysis.
