FP&A
Introducing “The Power of Storytelling in FP&A”
Discover the transformative power of storytelling in FP&A and learn how it can enhance communication, engagement, and decision-making in the world of finance.

Financial Planning and Analysis (FP&A) is an essential function of any organization. It involves analyzing financial data, creating forecasts, and providing insights to support decision-making. However, the traditional approach of presenting numbers and data can be dry and uninspiring. This is where the power of storytelling comes in.
Storytelling is a powerful tool that can help FP&A professionals communicate complex financial information in a way that is engaging, memorable, and actionable. By using stories, FP&A professionals can help decision-makers understand the context behind the numbers and make informed decisions that are aligned with the organization’s goals.
Why Storytelling Works
Humans are wired to respond to stories. Stories help us make sense of the world and connect with others on an emotional level. When we hear a story, our brains release oxytocin, a hormone that promotes empathy and trust. This makes stories a powerful tool for building relationships and influencing behaviour.
In the context of FP&A, storytelling can help decision-makers understand the impact of financial data on the organization’s goals and strategy. By presenting data in the form of a story, FP&A professionals can help decision-makers understand the context behind the numbers and make informed decisions that are aligned with the organization’s goals.

Abhishek Singh
Global Client Delivery Director
Abhi joined us in 2011 and heads up our Client Delivery Team from our US office. A devoted fan of the Indian cricket team and, when not watching cricket, plays cricket at a high level himself.
FOLLOW US
How to Use Storytelling in FP&A
Here are some tips for using storytelling in FP&A:
- Identify the key message: Before you start telling a story, make sure you know the key message you want to convey. What is the main point you want decision-makers to take away from your presentation? Once you have identified the key message, you can craft a story that supports it.
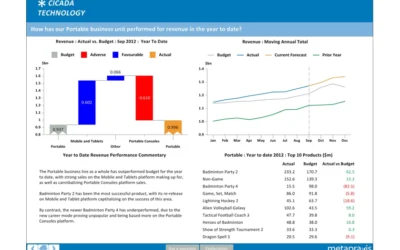
- Use data to support your story: While storytelling is important, it is still essential to use data to support your story. Use charts, graphs, and other visual aids to help decision-makers understand the data behind the story. This will help them see the connections between the numbers and the organization’s goals.
- Use real-life examples: Real-life examples are a powerful way to bring your story to life. Use examples from your own organization or from other companies to illustrate the impact of financial decisions. This will help decision-makers see the real-world consequences of their choices.
- Keep it simple: While it is important to use stories to make financial data more engaging, it is also important to keep the story simple. Avoid using jargon or technical terms that may confuse decision-makers. Keep the language simple and clear so that everyone can understand the story.
- Practice, practice, practice: Finally, practice your story before you present it. Practice in front of a mirror or with a colleague to make sure you are comfortable with the material. This will help you deliver the story with confidence and conviction.
Conclusion
In conclusion, storytelling is a powerful tool that can help FP&A professionals communicate complex financial information in a way that is engaging, memorable, and actionable. By using stories, FP&A professionals can help decision-makers understand the context behind the numbers and make informed decisions that are aligned with the organization’s goals. So, the next time you are preparing a financial presentation, consider using storytelling to make your message more impactful.
If you are interested in learning more about how Metapraxis can help your FP&A storytelling, please get in touch – we’d love to start a conversation!
Latest Posts
What makes a good Board Report?
FP&A What makes a good Board Report? We have created a set of key principles for companies looking to improve the relevance and usefulness of their Board ReportA company’s board of directors is collectively responsible for leading and directing its affairs in...
Fresh foods sector: understanding profitability
FP&A Fresh foods sector: understanding profitability We look at recent data from the UK retail industry, and at how profitability analysis can help make the most of seasonal variations in demand.Received wisdom may dictate that January is a lean month for food...
Moving Annual Average – a powerful data transformation
FP&A Moving Annual Average - a powerful data transformation Learn how to use a process to calculating an MATWe can’t use an MAT for a stock type item (like Accounts Receivable or Headcount) or a statistic (such as gross margin % or the £/$ Exchange Rate) because...


