FP&A
Moving Annual Average – a powerful data transformation
Learn how to use a process to calculating an MAT

We can’t use an MAT for a stock type item (like Accounts Receivable or Headcount) or a statistic (such as gross margin % or the £/$ Exchange Rate) because totalling these items overtime periods doesn’t make any sense.
In a previous post, we looked at the Moving Annual Total (MAT) as a simple, powerful way of eliminating seasonality within a 12 month period to enable the underlying trend of a data series to be discovered.
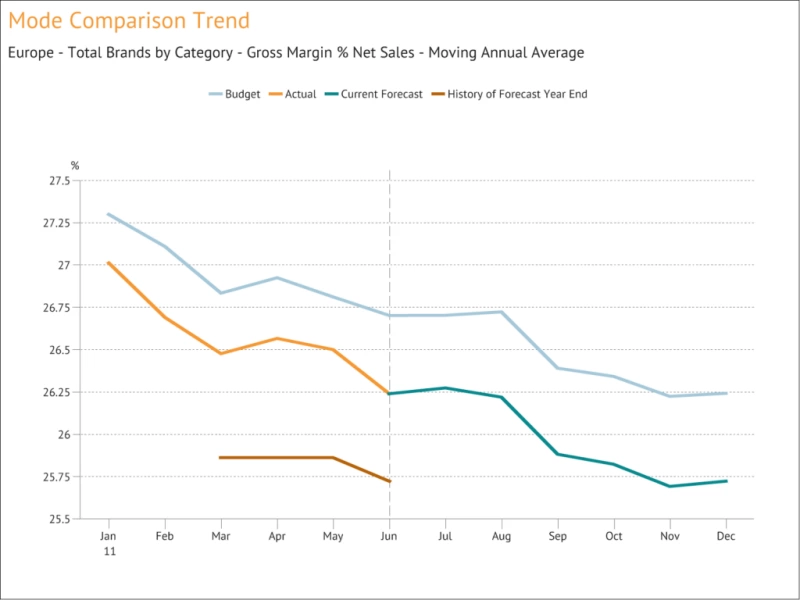
The MAT works fine for items that flow, like Sales, Profit and Shipment Volumes because these can be cumulated over time periods to provide meaningful totals. But we can’t use an MAT for a stock type item (like Accounts Receivable or Headcount) or a statistic (such as Gross Margin % or the £/$ Exchange Rate) because totalling these items over time periods doesn’t make any sense. The solution is to calculate the Moving Annual Average (MAA). The simplest way to calculate this is to use a very similar process to calculating an MAT – the end result is then divided by 12 (or however many periods we have within our year) to provide an average monthly value.
In cases of statistics like Gross Margin % (made from a flow item divided by another flow item), we can construct a more accurate weighted average value for each month by calculating the total of the last 12 months for both the numerator and denominator of the ratio and then dividing one by the other.

Abhishek Singh
Global Client Delivery Director
Abhi joined us in 2011 and heads up our Client Delivery Team from our US office. A devoted fan of the Indian cricket team and, when not watching cricket, plays cricket at a high level himself.
FOLLOW US

A statistic such as Return on Capital Employed % (made from a flow item divided by a stock item) requires a more elaborate calculation, because by convention the value for such a ratio is normally displayed as an annual value. Hence, we need to calculate the total of the last 12 months Profit and divide by the weighted average of Capital Employed over that 12 month period. The MAA transformation of data is very flexible because it can be applied to all types of data items, whether they are flows, stocks or statistics. By comparison, MATs can only be calculated for flow type items so must be used with care.
Latest Posts
Cyber-crime white paper
FP&A Cyber-crime white paper Cyber-crime and ransomware attacks are an ever-increasing threat. Business leaders must prioritise defending against and preparing for a cyber-attack or the costs can be catastrophic, but how can businesses best protect themselves and...
Navigating Challenges in Construction
EBOOKS Navigating Challenges in Construction The construction industry is currently facing significant challenges, including economic volatility, policy uncertainties, and a lag in technological integration. These factors have led to a notable decline in project...
Navigating the Complexities of Franchise Business Management
FP&A Navigating the Complexities of Franchise Business Management Franchise businesses face significant challenges in balancing operational demands with strategic growth, often hindered by inefficient processes and systems that must evolve to drive performance and...


