FP&A
Moving Annual Average – a powerful data transformation
Learn how to use a process to calculating an MAT

We can’t use an MAT for a stock type item (like Accounts Receivable or Headcount) or a statistic (such as gross margin % or the £/$ Exchange Rate) because totalling these items overtime periods doesn’t make any sense.
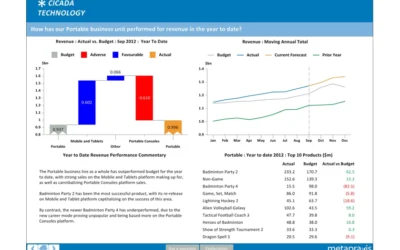
In a previous post, we looked at the Moving Annual Total (MAT) as a simple, powerful way of eliminating seasonality within a 12 month period to enable the underlying trend of a data series to be discovered.
The MAT works fine for items that flow, like Sales, Profit and Shipment Volumes because these can be cumulated over time periods to provide meaningful totals. But we can’t use an MAT for a stock type item (like Accounts Receivable or Headcount) or a statistic (such as Gross Margin % or the £/$ Exchange Rate) because totalling these items over time periods doesn’t make any sense. The solution is to calculate the Moving Annual Average (MAA). The simplest way to calculate this is to use a very similar process to calculating an MAT – the end result is then divided by 12 (or however many periods we have within our year) to provide an average monthly value.
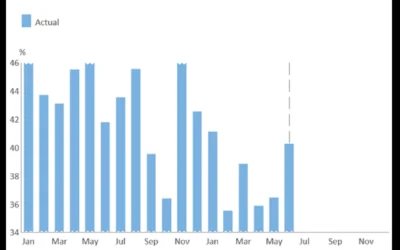
In cases of statistics like Gross Margin % (made from a flow item divided by another flow item), we can construct a more accurate weighted average value for each month by calculating the total of the last 12 months for both the numerator and denominator of the ratio and then dividing one by the other.

Abhishek Singh
Global Client Delivery Director
Abhi joined us in 2011 and heads up our Client Delivery Team from our US office. A devoted fan of the Indian cricket team and, when not watching cricket, plays cricket at a high level himself.
FOLLOW US
A statistic such as Return on Capital Employed % (made from a flow item divided by a stock item) requires a more elaborate calculation, because by convention the value for such a ratio is normally displayed as an annual value. Hence, we need to calculate the total of the last 12 months Profit and divide by the weighted average of Capital Employed over that 12 month period. The MAA transformation of data is very flexible because it can be applied to all types of data items, whether they are flows, stocks or statistics. By comparison, MATs can only be calculated for flow type items so must be used with care.
Latest Posts
What makes a good Board Report?
FP&A What makes a good Board Report? We have created a set of key principles for companies looking to improve the relevance and usefulness of their Board ReportA company’s board of directors is collectively responsible for leading and directing its affairs in...

Fresh foods sector: understanding profitability
FP&A Fresh foods sector: understanding profitability We look at recent data from the UK retail industry, and at how profitability analysis can help make the most of seasonal variations in demand.Received wisdom may dictate that January is a lean month for food...
Choosing the scale for a graph
FP&A Choosing the scale for a graph The scale for a graph axis can have significant impact on how an audience interprets a message and is an important part of optimising data visualization.The scale selected for a graph axis has a significant impact on how the...