WHITEPAPER
Board reporting white paper
Most board reports look back, not forward. This white paper reveals how to transform reporting into a source of foresight, alignment, and commercial insight, so leadership teams can act before risks become losses.

“You can’t scale on yesterday’s news.”
Most board packs are beautifully presented post-mortems. They explain what already happened, but rarely what’s coming next. By the time performance risks or margin leaks appear in the numbers, the opportunity to act has already passed.
The truth is, backward-looking reporting holds leadership teams back. What boards really need is foresight: predictive insight that aligns strategy with operations and flags risks before they become losses.
In our new white paper, Why Your Board Reports Are Holding You Back, and What Good Looks Like, we explore how to shift from historic reporting to forward-looking insight that drives growth, alignment, and value.

Anousk Backshall
Head of Customer Insights
Joined the team in 2011 and is responsible for delivering the internal and external communications agenda, as well as providing design and composition of branded content across social media and the company’s digital presence.
Latest Posts

Fresh foods sector: understanding profitability
FP&A Fresh foods sector: understanding profitability We look at recent data from the UK retail industry, and at how profitability analysis can help make the most of seasonal variations in demand.Received wisdom may dictate that January is a lean month for food...
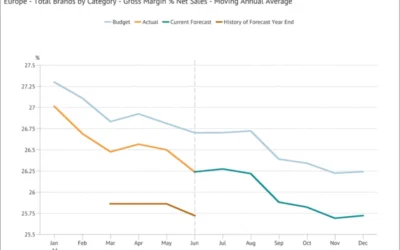
Moving Annual Average – a powerful data transformation
FP&A Moving Annual Average - a powerful data transformation Learn how to use a process to calculating an MATWe can’t use an MAT for a stock type item (like Accounts Receivable or Headcount) or a statistic (such as gross margin % or the £/$ Exchange Rate) because...
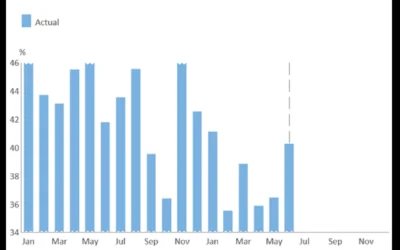
Choosing the scale for a graph
FP&A Choosing the scale for a graph The scale for a graph axis can have significant impact on how an audience interprets a message and is an important part of optimising data visualization.The scale selected for a graph axis has a significant impact on how the...